|
|
DESIGN: GRAPHIC DESIGN: COLORADO GOVERNORS ENERGY OFFICE
|
||

|
Connecting Colorado's Renewable Resources to the Markets This book defines Colorado's potential as a national resource of renewable energy. 7 custom maps were generated to illustrate these opportunities. The appendices also included graphically-enhanced versions of existing maps. Click here to downwnload a PDF.
Renewable Energy Development Infrastructure [ Redi Report ] This second report contains a variety of custom maps and charts. |
|
|
 |
The 64 page book defines the generation development areas (GDA's), using elaborate maps which showed additional information such as topography, and the existing transmission grid. The maps were made with data from various agencies, processed and extracted from a GIS system. These files were made into layered image files. Careful tuning of the colors and effects on those layers permitted complex overlays of data while maintaining the visual clarity of the most important data. |
||
 |
Detail of hydropower map. Yellow lines are the transmission grid. The red line is I-70. The visual emphasis is on the various hydro data-points. |
||
 |
Detail of geothermal map. Isobars show heat flow. |
||
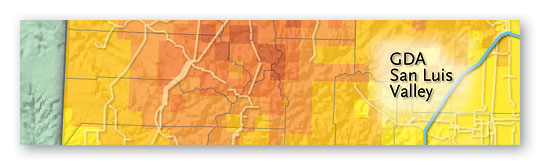 |
Detail of concentrating solar GDA map. The gradation from brown to bright yellow coded the available sun. The blue outlines the identified Generation Development Area. |
||
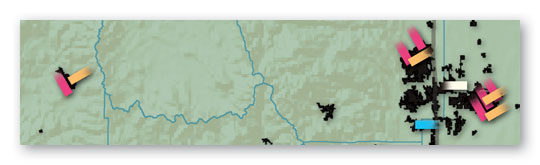 |
Detail of the ethanol map. The colored data symbols display ethanol production and distribution in the state. |
||
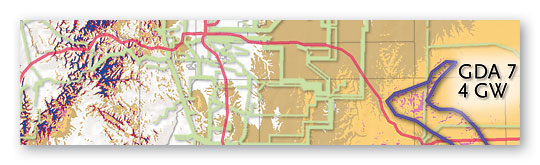 |
Detail of the wind resource map. The green lines are the transmission grid. The red line codes interstate highways. The blue line codes the GDA's. The wind resource is expressed by a complex topological color gradation in the backgroud. |
||